Chapter 7, Limitations of animint2, and workarounds
This chapter explains several known limitations of animint2 for some interactive data visualization tasks. It also explains some workarounds that you can use in these situations. After reading this chapter, you will understand how to
- Use a normalized variable when different
showSelectedsubsets have very different values of a variable you want to display. - Compute statistics for each
showSelectedsubset, rather than relying on thestat_*functions inggplot2. - Add data one at a time to a multiple selection variable set, rather than using a rectangular selection brush.
- Avoid using
vjustand labels with multiple lines ingeom_text. - Order the plots on the page.
- Avoid using some unsupported
themeoptions. - Use facets with multiple variables per axis.
- Use the
shinyweb server package to interactively change the aesthetic mapping of an animint, or to perform computations based on selected values.
If you have an idea for improving animint2 so that it overcomes one of these limitations, the animint2 developers would be more than happy to accept your Pull Request.
Use normalized variables to work with fixed scales
We implement axes and legends in the same way ggplot2 does, by computing them once when the plot is first rendered. As a consequence, the axes and legends in each animint plot are not interactive. For most animated data visualizations, fixed axes make it easy to understand how the data changes along with the time variable.
There are some situations where it would be useful to have axes that interactively update. One example is when different showSelected subsets have very different values for variables that are shown with an axis or legend. In this case it would be useful to have interactive axes that update and change along with the data. We have experimental support for this, see the update axes test for details.
Compute statistics for each showSeleted subset
Animint does not support ggplot2 statistics with showSelected. For example, consider the facetted ggplot below.
set.seed(1)
library(data.table)
random.counts <- data.table(
  letter = c(replicate(4, LETTERS[1:5])),
  count = c(replicate(4, rbinom(5, 50, 0.5))),
  stack = rep(rep(1:2, each = 5), 2),
  facet = rep(1:2, each = 10))
library(animint2)
ggstat <- ggplot() +
  theme_bw()+
  theme(panel.margin=grid::unit(0, "lines"))+
  geom_bar(
      aes(letter, count, fill = stack),
      showSelected="facet",
    data = random.counts,
    stat = "identity",
    position="stack"
  )
ggstat+facet_grid(facet ~ .)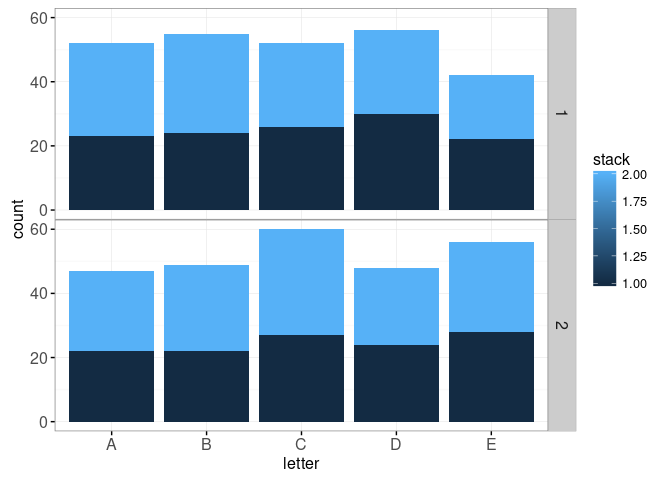
Using showSelected instead of facets does not result in what you may expect.
animint(
  plot = ggstat,
  time = list(variable = "facet", ms = 1000),
  duration = list(facet = 1000))
## mapping: x = letter, y = count, fill = stack, showSelected1 = facet
## geom_bar: width = NULL, na.rm = FALSE
## stat_identity: na.rm = FALSE
## position_stack## Warning in f(...): showSelected only works with position=identity, problem:
## geom1_bar_plot## Warning in issueSelectorWarnings(meta$geoms, meta$selector.aes, meta$duration):
## to ensure that smooth transitions are interpretable, aes(key) should be
## specifed for geoms with showSelected=facet, problem: geom1_bar_plot
A workaround is to compute what you want to display, and use position=identity.
random.cumsums <- random.counts[, list(
  cumsum=cumsum(count),
  count=count,
  stack=stack),
  by=.(letter, facet)]
ggidentity <- ggplot() +
  theme_bw()+
  theme(panel.margin=grid::unit(0, "lines"))+
  geom_segment(aes(
    x=letter, xend=letter,
    y=cumsum, yend=cumsum-count,
    color=stack),
    showSelected="facet",
    data = random.cumsums,
    size=10,
    stat = "identity",
    position="identity")
ggidentity+facet_grid(facet ~ .)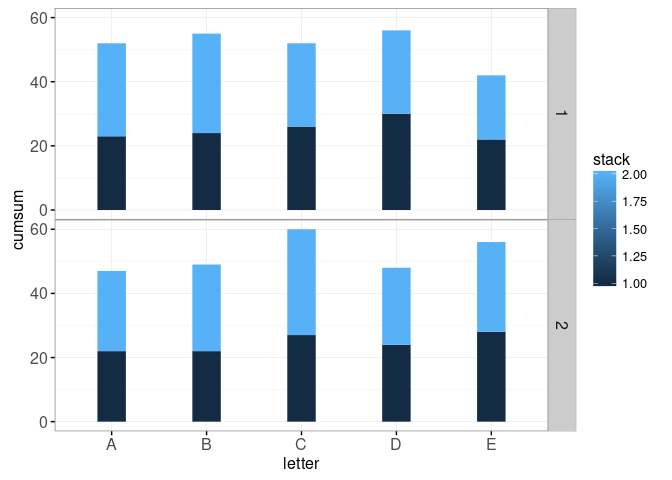
Note how we used geom_segment instead of geom_bar, but their appearance is similar.
animint(
  plot = ggidentity,
  time = list(variable = "facet", ms = 1000),
  duration = list(facet = 1000))
## Warning in issueSelectorWarnings(meta$geoms, meta$selector.aes, meta$duration):
## to ensure that smooth transitions are interpretable, aes(key) should be
## specifed for geoms with showSelected=facet, problem: geom1_segment_plot
Add values to a multiple selection set one at a time
Animint does not support a rectangular brush or lasso for interactively defining a set of selected values. Instead, animint supports multiple selection by adding values one by one to the multiple selection set. Use the selector.types option to declare a multiple selection variable.
Adjust y instead of using vjust
For horizontal text alignment, animint supports using hjust in R with the most common values: 0 for left alignment, 0.5 for middle alignment, and 1 for right alignment. Animint translates these three hjust values to the text-anchor property in the rendered data viz.
However, animint does not support vertical text alignment using vjust in R, because there is no property that can be used for vertical text alignment in SVG.
line.df <- data.frame(just=c(0, 0.5, 1))
text.df <- expand.grid(
  vjust=line.df$just,
  hjust=line.df$just)
gg.lines <- ggplot()+
  theme_bw()+
  geom_vline(aes(xintercept=just), data=line.df, color="grey")+
  geom_hline(aes(yintercept=just), data=line.df, color="grey")
gg.vjust <- gg.lines+
  geom_text(aes(
    hjust, vjust, label="qwerty", hjust=hjust, vjust=vjust),
    data=text.df)
gg.vjust+ggtitle("R graphics devices respect aes(vjust)")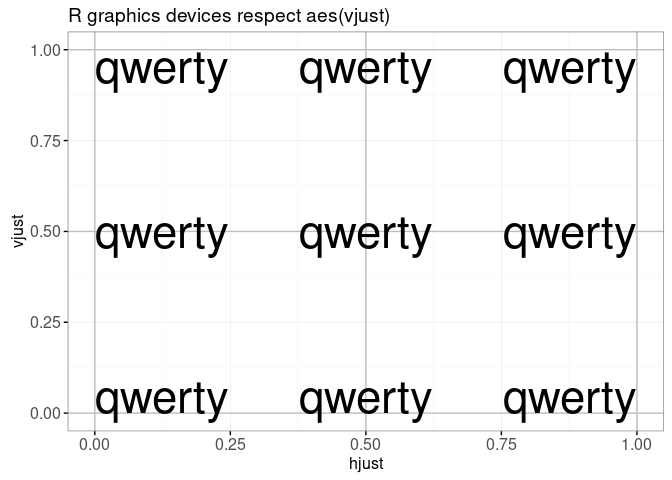
Note how both hjust and vjust are respected in the static ggplot above. In contrast, consider the animint below. The left plot should be the same as the ggplot above, but there are clear differences in terms of vertical placement of the text elements.
(viz.just <- animint(
  vjust=gg.vjust+
    ggtitle("animint does not support aes(vjust)"),
  workaround=gg.lines+
    ggtitle("workaround: no aes(vjust), add to y")+
    geom_text(aes(
      hjust, vjust + (0.5-vjust)*0.03 - 0.01,
      label="qwerty", hjust=hjust),
      data=text.df)))
## [1] 0.5 1.0## Warning in vjustWarning(g.data$vjust): animint only supports vjust=0
The workaround in animint is shown in the right panel above. You can adjust the vertical position y values of the text elements for which you would have used vjust.
It is possible to implement vjust support in animint, but we haven’t yet had time to work on it. If you would like to implement it, we would be more than happy to accept a Pull Request. We already have an issue explaining how to implement it.
Order the plots on the page
Currently the only way to organize a multi-plot data viz is using the order of the ggplots in the animint viz list. The plots will appear on the web page in the same order as they occur in the animint viz list. For example, compare the data viz below with the data viz from the previous section.
animint(
  first=viz.just$workaround,
  second=viz.just$vjust)
## [1] 0.5 1.0## Warning in vjustWarning(g.data$vjust): animint only supports vjust=0
Note how the order of plots is reversed with respect to the data viz from the previous section. The main limitation of this method for plot layout is that only the order can be controlled. For example, depending on the width of the web page element in which the data viz above is rendered, the second plot will appear either below the first plot, or to the right of it.
If you have an idea for a better way to define the layout of plots in an animint, please tell us!
Avoid line breaks in text labels
When rendering a ggplot using regular R graphics devices, using a line break or newline \n in a geom_text label results in multiple lines of text on the plot.
gg.return <- ggplot()+
  geom_text(aes(
    hjust, vjust, label=sprintf("x=%.1f\ny=%.1f", hjust, vjust)),
    data=text.df)
gg.return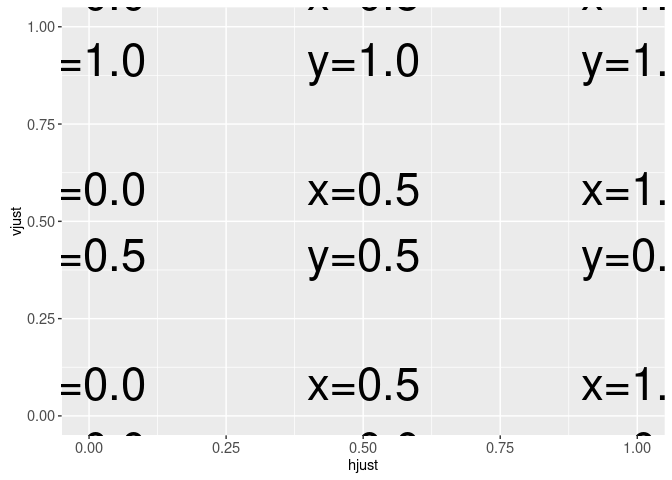
However, animint only supports drawing the first line of text.
animint(gg.return)
It would be nice to support multiple lines in geom_text labels, but we have not yet had time to implement that. However, we have an issue, and would be willing to accept a Pull Request which implements that.
Until then, the workaround is to use one geom_text layer for each line of text that you want to display:
gg.two.lines <- ggplot()+
  geom_text(aes(
    hjust, vjust, label=sprintf("x=%.1f", hjust)),
    data=text.df)+
  geom_text(aes(
    hjust, vjust-0.05, label=sprintf("y=%.1f", vjust)),
    data=text.df)
gg.two.lines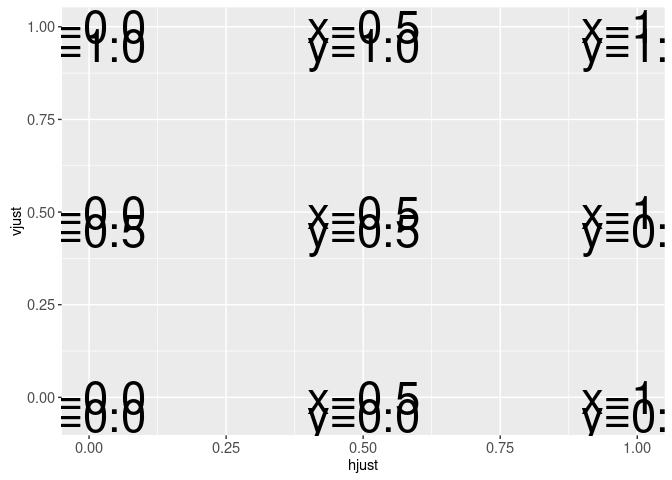
animint(gg.two.lines)
Avoid some ggplot theme options
One goal of animint is to support all of the theme options, but we have not yet had time to implement them all. If there is a theme option that you use and animint does not yet support, then please send us a Pull Request. The following list documents all the theme options that animint currently supports.
panel.margindesignates the distance between panels, and is used in the space saving facets idiom to eliminate the distance between panels.panel.grid.majoris used to draw the the grid lines which are designated by thebreaksargument to the scale.panel.grid.minoris used to draw the grid lines between the major grid lines.panel.backgroundis used for the<rect>in background of each panel.panel.borderis used for the border<rect>of each panel (on top of the background<rect>).legend.position="none"works for hiding all of the legends, but none of the other legend positions are supported (the legends always appear on the right of the plot).
The following theme options can be set to element_blank to hide the axes.
axis.title,axis.title.x,axis.title.ydesignate the axis title.axis.ticks,axis.ticks.x,axis.ticks.ydesignate teh axis ticks.axis.line,axis.line.x,axis.line.ydesignate the axis line.axis.text,axis.text.x,axis.text.ydesignate the axis tick label text, and support theangleandhjustarguments ofelement_text.
Facets with multiple variables per axis
Animint supports facet_grid for creating multi-panel data visualizations, but only has limited support for multiple variables per axis. For example the ggplot below uses two variables to create vertical facets, which results in two strip labels when rendered with ggplot2.
data(intreg)
signals.df <- transform(
  intreg$signals,
  person=sub("[.].*", "p", signal),
  chromosome=sub(".*[.]", "c", signal))
two.strips <- ggplot()+
  theme_animint(height=600)+
  facet_grid(person + chromosome ~ ., scales="free")+
  geom_point(aes(base/1e6, logratio), data=signals.df)
two.strips+ggtitle("two strip labels on the right")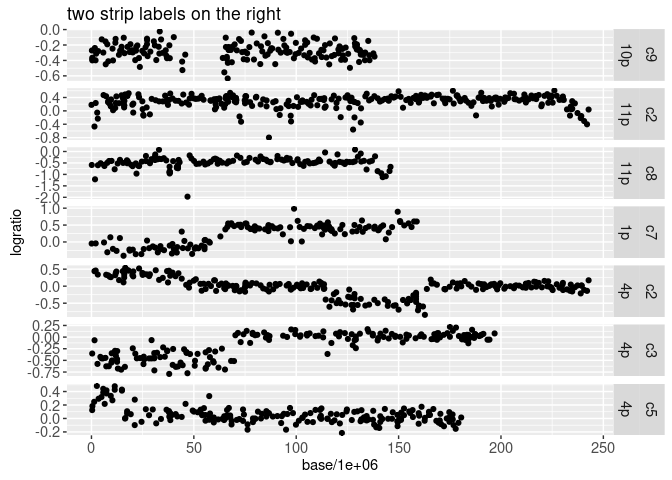
In contrast, animint renders the same ggplot below using only one strip label.
animint(two.strips+ggtitle("only one strip label"))
It would be nice to support multiple strip labels per axis, but we have not yet had time to implement it. If you would like to implement this feature, we would be happy to accept your Pull Request.
Interactive definition of aesthetic mappings using shiny
Normally, aesthetic mappings are defined once in R code, and can not be changed after rendering an animint. One way to overcome this limitation is by defining shiny inputs that are used as animint aesthetics, as in the following example.
shiny::runApp(system.file("examples", "shiny-WorldBank", package="animint"))Interactive computation
Another limitation is that animint can only display data that can be computed and stored in a data table before creating the visualization. This means that animint is not appropriate when there are more subsets of data to plot than you could ever compute. In that case, it would be better to use shiny.
Chapter summary and exercises
We discussed limitations of the current implementation of animint2, and explained several workarounds.
Exercises:
- Make a facetted ggplot with
stat_binthat will not work with animint when the facet variable is instead used as a showSelected variable. Compute the stat yourself for each facet, and usestat_identityto make it work with animint. - Make a ggplot which displays fine using
facet_grid(. ~ var, scales="free")but does not display well in animint withshowSelected=var. To fix the problem, compute a normalized version ofvarand use that for theshowSelectedvariable.
Next, Chapter 8 explains how to create a multi-panel visualization of the World Bank data.
